
September & October 2026 · Florida home insurance
Are Florida home insurance rates going down in 2026?
Yes, many Florida insurers are reducing rates in 2026. September and October brought more announced cuts, and shopping your home may uncover a better price. Below, I share a table of real September and October 2026 Florida home insurance quotes, sorted by ZIP code, with annual premiums, year built, dwelling coverage and deductibles.
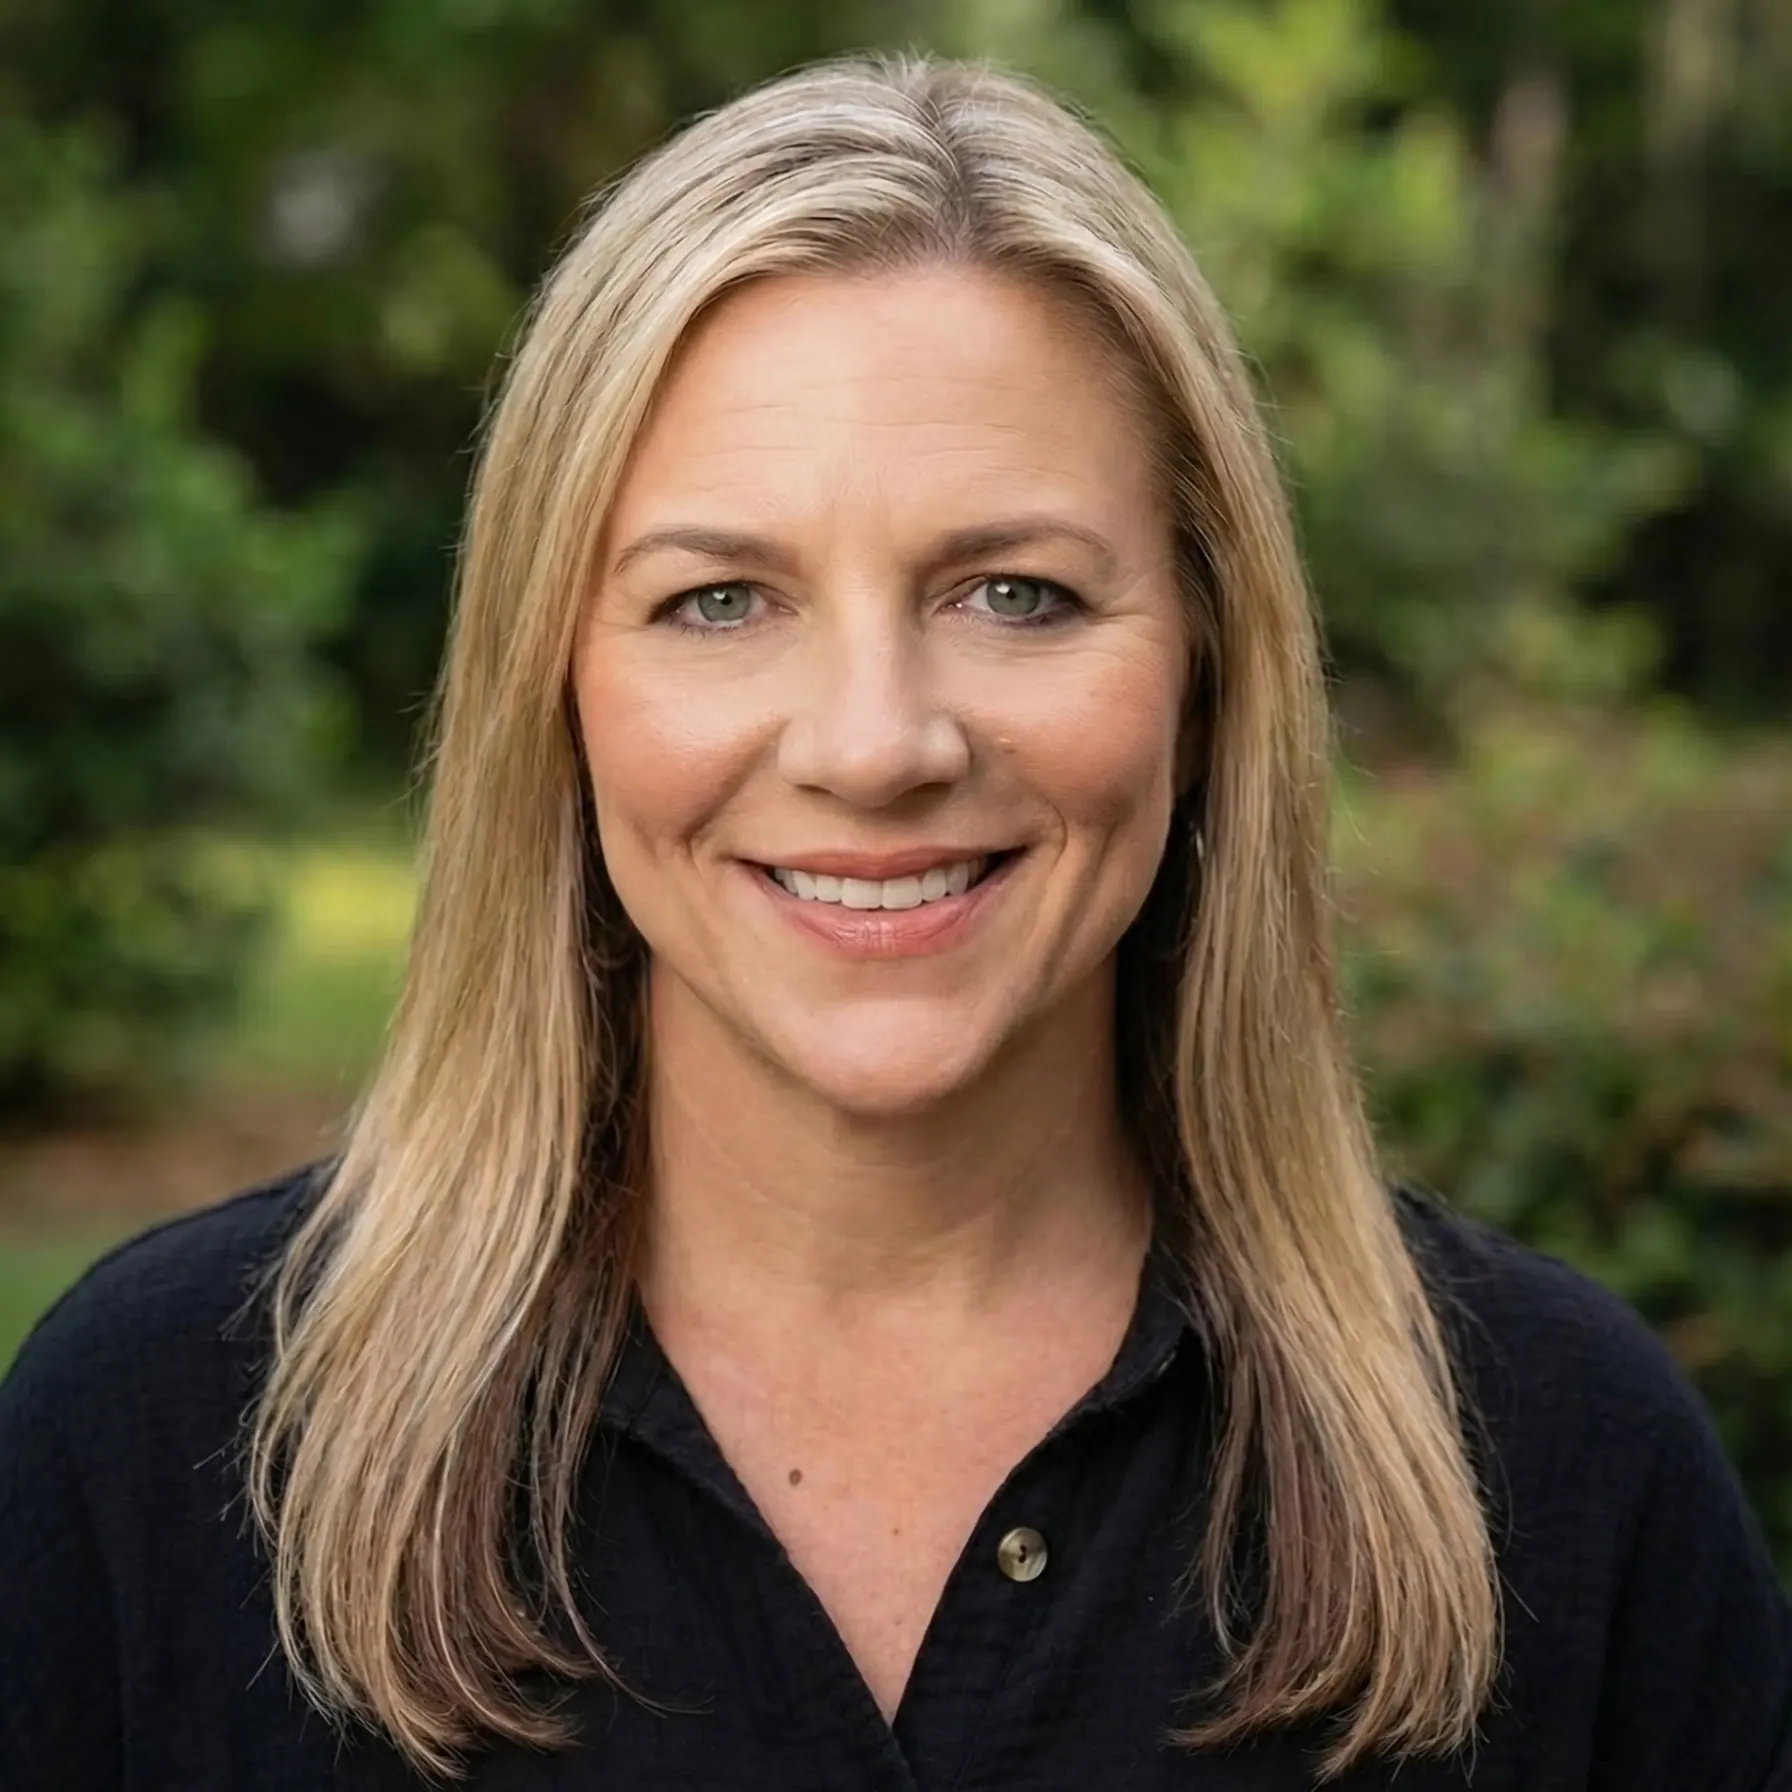
Personal Insurance Team Leader · Florida license W055787
Start with your address. We’ll help compare price and coverage.
Jenna’s perspective
Lower rates give us a reason to take another look.
After years of difficult renewals, I understand why a headline about falling home insurance rates might sound too good to be true. There is real movement in the Florida market. The question I want to help you answer is simpler: what can we find for your home, with coverage you’re comfortable keeping?
At Greene & Associates, we use AI technology alongside our comparative rater to help us shop homes with multiple carriers. My team reviews the options and coverage differences so we can help you find the best price available through the carriers we work with for the coverage you choose.
I’ve pulled together our September and October quote examples below. Each shows the lowest premium returned for that home’s quoted scenario, alongside its dwelling limit and deductibles. You can see the numbers without sharing your contact details first.
September 22
More than 62,000 policies
Florida’s Office of Insurance Regulation announced approved reductions affecting more than 62,000 policies. It also reported a −4.8% 30-day average requested rate change. That is a filing measure, not a 4.8% savings promise for every home.
Read the September OIR announcement ↗October 29
More October reductions
Florida regulators reported decreases taking effect in October for new policies or renewals affecting more than 824,300 homeowners, including decreases up to 12.1%. The change for an individual policy can differ.
Read the October announcement ↗Those announcements support the improving-rate story. Our quotes show actual options returned for individual homes. They are different types of evidence: this collection does not measure how much the same homes’ premiums fell from September to October.
Our September & October quote notebook
What came back for homes across Florida?
Find a ZIP code or county, then compare the year built, dwelling coverage and deductibles beside the price.
Quotes from September and October 2026, collected through October 31. These are selected individual quotes, not county averages or prices available to every home in a ZIP code. We don’t show our partner carriers’ names in public rate comparisons.
| ZIP / location | Quoted | Year built | Dwelling Coverage A | AOP deductible | Hurricane deductible | Lowest returned annual premium |
|---|---|---|---|---|---|---|
| 32024Lake CitySuwannee County | 2004 | $310,000 | $1,000 | 2%$6,200 of Coverage A | $2,051.00/ yearWater damage excluded | |
| 32025Lake CityColumbia County | 1952 | $150,000 | $1,000 | 2%$3,000 of Coverage A | $965.29/ yearLimited water damage coverage | |
| 32025Lake CityColumbia County | 1966 | $370,000 | $1,000 | 2%$7,400 of Coverage A | $1,050.90/ yearWater coverage restrictions | |
| 32054Lake ButlerUnion County | 1977 | $441,000 | $1,000 | 2%$8,820 of Coverage A | $2,301.00/ yearLimited water damage coverage | |
| 32055Lake CityColumbia County | 1955 | $200,000 | $1,000 | 2%$4,000 of Coverage A | $967.00/ yearLimited water damage coverage | |
| 32055Lake CityColumbia County | 1992 | $674,000 | $2,500 | 2%$13,480 of Coverage A | $1,987.00/ year | |
| 32060Live OakSuwannee County | 2026 | $300,000 | $1,000 | 2%$6,000 of Coverage A | $893.00/ year | |
| 32064Dowling ParkSuwannee County | 2004 | $250,000 | $1,000 | 2%$5,000 of Coverage A | $1,194.56/ year | |
| 32065Orange ParkClay County | 1992 | $330,000 | $2,500 | 2%$6,600 of Coverage A | $1,495.25/ yearWater coverage restrictions | |
| 32068MiddleburgClay County | 2005 | $350,000 | $500 | 2%$7,000 of Coverage A | $1,874.20/ year | |
| 32092St. AugustineSt. Johns County | 2020 | $625,000 | $2,500 | 2%$12,500 of Coverage A | $1,248.00/ year | |
| 32168New Smyrna BeachVolusia County | 2015 | $1,600,000 | $2,500 | 2%$32,000 of Coverage A | $3,948.71/ year | |
| 32169New Smyrna BeachVolusia County | 1964 | $500,000 | $2,500 | 2%$10,000 of Coverage A | $5,784.74/ year | |
| 32206JacksonvilleDuval County | 1928 | $150,000 | $2,500 | 2%$3,000 of Coverage A | $951.00/ yearLimited water damage coverage | |
| 32209JacksonvilleDuval County | 1939 | $200,000 | $2,500 | 2%$4,000 of Coverage A | $1,480.00/ yearLimited water damage coverage | |
| 32218JacksonvilleDuval County | 2007 | $505,000 | $2,500 | 2%$10,100 of Coverage A | $2,902.00/ year | |
| 32222JacksonvilleDuval County | 2020 | $325,000 | $2,500 | 2%$6,500 of Coverage A | $825.58/ year | |
| 32250Jacksonville BeachDuval County | 1986 | $500,000 | $2,500 | $1,000Flat dollar deductible | $8,885.00/ yearLimited water damage coverage | |
| 32258JacksonvilleDuval County | 2009 | $500,000 | $2,500 | 2%$10,000 of Coverage A | $1,859.21/ year | |
| 32277JacksonvilleDuval County | 1995 | $404,000 | $2,500 | 2%$8,080 of Coverage A | $1,545.55/ yearWater coverage restrictions | |
| 32444Lynn HavenBay County | 2004 | $500,000 | $2,500 | 2%$10,000 of Coverage A | $3,976.00/ yearWater damage excluded | |
| 32507PensacolaEscambia County | 1992 | $600,000 | $2,500 | 2%$12,000 of Coverage A | $9,698.00/ yearWater damage excluded | |
| 32514PensacolaEscambia County | 1984 | $281,000 | $2,500 | 2%$5,620 of Coverage A | $3,937.72/ yearLimited water damage coverage | |
| 32566NavarreSanta Rosa County | 2014 | $365,000 | $2,500 | 2%$7,300 of Coverage A | $2,318.06/ year | |
| 32712ApopkaOrange County | 1986 | $500,000 | $2,500 | 2%$10,000 of Coverage A | $2,193.72/ year | |
| 32725DeltonaVolusia County | 1977 | $260,000 | $2,500 | 2%$5,200 of Coverage A | $1,072.00/ year | |
| 32905Palm BayBrevard County | 2016 | $500,000 | $1,000 | 2%$10,000 of Coverage A | $1,374.46/ year | |
| 32948FellsmereIndian River County | 2007 | $725,000 | $2,500 | 2%$14,500 of Coverage A | $3,578.58/ year | |
| 32955RockledgeBrevard County | 1988 | $370,000 | $2,500 | 2%$7,400 of Coverage A | $3,866.00/ year | |
| 33020HollywoodBroward County | 2001 | $377,000 | $2,500 | 2%$7,540 of Coverage A | $5,389.43/ year | |
| 33020HollywoodBroward County | 1958 | $500,000 | $2,500 | 2%$10,000 of Coverage A | $5,719.83/ year | |
| 33179MiamiMiami-Dade County | 1966 | $2,000,000 | $2,500 | 2%$40,000 of Coverage A | $91,001.74/ year | |
| 33181North MiamiMiami-Dade County | 1976 | $1,200,000 | $5,000 | 5%$60,000 of Coverage A | $13,696.65/ year$10,000 water limit; personal property at actual cash value | |
| 33311Fort LauderdaleBroward County | 1949 | $500,000 | $2,500 | 2%$10,000 of Coverage A | $6,911.03/ year | |
| 33426Boynton BeachPalm Beach County | 2003 | $375,000 | $2,500 | 2%$7,500 of Coverage A | $4,895.20/ year | |
| 33511BrandonHillsborough County | 1995 | $500,000 | $2,500 | 2%$10,000 of Coverage A | $2,801.05/ yearWater coverage restrictions | |
| 33541ZephyrhillsPasco County | 2001 | $265,000 | $2,500 | 2%$5,300 of Coverage A | $2,355.00/ year | |
| 33572Apollo BeachHillsborough County | 2006 | $500,000 | $1,000 | 2%$10,000 of Coverage A | $2,596.46/ year | |
| 33647TampaHillsborough County | 2005 | $625,000 | $2,500 | 2%$12,500 of Coverage A | $1,973.96/ year | |
| 33703St. PetersburgPinellas County | 1960 | $200,000 | $2,500 | 2%$4,000 of Coverage A | $3,011.00/ yearWater damage excluded | |
| 33714St. PetersburgPinellas County | 1959 | $210,300 | $2,500 | 5%$10,515 of Coverage A | $1,964.00/ yearWater damage excluded | |
| 33837DavenportPolk County | 2007 | $600,000 | $2,500 | 2%$12,000 of Coverage A | $2,110.46/ year | |
| 33844Haines CityPolk County | 2006 | $500,000 | $2,500 | 2%$10,000 of Coverage A | $1,856.46/ year | |
| 33860MulberryPolk County | 2007 | $500,000 | $2,500 | 2%$10,000 of Coverage A | $1,867.46/ year | |
| 33928EsteroLee County | 2023 | $775,000 | $2,500 | 2%$15,500 of Coverage A | $2,753.20/ year | |
| 33991Cape CoralLee County | 2000 | $500,000 | $1,000 | 2%$10,000 of Coverage A | $2,650.46/ year | |
| 34109NaplesCollier County | 1998 | $900,000 | $2,500 | 2%$18,000 of Coverage A | $7,673.21/ yearWater coverage restrictions | |
| 34202Lakewood RanchManatee County | 2026 | $1,500,000 | $1,000 | 2%$30,000 of Coverage A | $1,911.31/ year | |
| 34203BradentonManatee County | 2021 | $420,000 | $2,500 | 2%$8,400 of Coverage A | $1,097.46/ year | |
| 34221PalmettoManatee County | 1983 | $415,000 | $1,000 | 2%$8,300 of Coverage A | $6,301.12/ yearLimited water damage coverage | |
| 34236SarasotaSarasota County | 2014 | $1,500,000 | $2,500 | 2%$30,000 of Coverage A | $8,558.46/ year | |
| 34240SarasotaSarasota County | 1999 | $775,000 | $2,500 | 2%$15,500 of Coverage A | $5,240.62/ year | |
| 34241SarasotaSarasota County | 2015 | $860,000 | $2,500 | 2%$17,200 of Coverage A | $2,600.89/ year | |
| 34275NokomisSarasota County | 2021 | $900,000 | $2,500 | 2%$18,000 of Coverage A | $2,438.45/ year | |
| 34473OcalaMarion County | 2021 | $250,000 | $2,500 | 2%$5,000 of Coverage A | $558.30/ year | |
| 34607Spring HillHernando County | 1986 | $500,000 | $2,500 | 2%$10,000 of Coverage A | $2,986.07/ year | |
| 34638Land O' LakesPasco County | 2019 | $588,000 | $2,500 | 2%$11,760 of Coverage A | $2,011.00/ year | |
| 34655New Port RicheyPasco County | 2006 | $200,000 | $2,500 | 2%$4,000 of Coverage A | $1,819.00/ year | |
| 34667HudsonPasco County | 1978 | $320,000 | $2,500 | 2%$6,400 of Coverage A | $4,102.00/ year | |
| 34695Safety HarborPinellas County | 1988 | $895,000 | $2,500 | 2%$17,900 of Coverage A | $7,339.44/ year | |
| 34711ClermontLake County | 1950 | $500,000 | $1,000 | 2%$10,000 of Coverage A | $2,645.95/ yearWater coverage restrictions | |
| 34736GrovelandLake County | 2007 | $175,000 | $2,500 | 2%$3,500 of Coverage A | $1,118.00/ year | |
| 34747CelebrationOsceola County | 2004 | $675,000 | $1,000 | 2%$13,500 of Coverage A | $4,850.77/ year | |
| 34786WindermereOrange County | 2021 | $726,000 | $2,500 | 2%$14,520 of Coverage A | $1,862.17/ yearLimited water damage coverage |
No examples match that search. We can still check options for your home.
Year built is the home’s construction year, not its roof replacement year. AOP means all-other-perils deductible. Percentage-based hurricane deductibles are also shown in dollars using Coverage A. Prices are annual premiums returned for the selected home and coverage scenario, not a guarantee of coverage or a bound policy. We confirm final coverage and any applicable fees with your personal quote. Water coverage differences are noted where reported.
Your ZIP is only the starting point.
Let us compare options for your address, home and coverage needs.
Two homes in the same ZIP can have very different prices.
In Lake City’s 32025 ZIP code, one home with $150,000 in dwelling coverage returned a low annual quote of $965.29 on September 23. Another home with $370,000 in dwelling coverage returned $1,050.90 a year on October 23. Both scenarios used a $1,000 AOP deductible and a 2% hurricane deductible.
The hurricane deductible is $3,000 on the first home and $7,400 on the second. That is why I like to show the dollar amount with the percentage. These are two different homes, so the price difference cannot tell us what increasing coverage would cost on your policy.
Coverage A is the dwelling insurance limit, not the home’s sale price. A “$650,000 house” does not automatically need $650,000 in dwelling coverage. We look at the cost to rebuild the home and the insurer’s requirements.
What I check before calling a lower quote a better option
The premium gets your attention. The coverage tells us whether it is a good fit. I want to know what you would be keeping, changing or giving up.
- The dwelling limit. We compare enough coverage for the home, rather than lowering the limit just to produce a smaller number.
- Both deductibles. A higher hurricane deductible can reduce premium while increasing what you pay after a covered loss.
- Water and roof coverage. A lower-priced option can have different water limits, exclusions or roof settlement terms.
- Wind credits and home details. We check the information and available documentation that can affect your options.
If you want a fuller look at how options differ for the same home, our real home insurance quote comparisons show that detail. For broader context, see our Florida home insurance cost guide and county rate guide.
Questions I’d ask, too
What does the improving market mean for you?
Why did my renewal go up if Florida home insurance rates are falling?
A carrier’s rate decrease does not guarantee a lower total premium for every policy. Your dwelling limit, rating details, discounts and coverage can change too. I would compare your renewal with the current policy, then check what our other carriers return for the home.
Is the lowest quote in my ZIP what I should expect to pay?
No. It is a real returned price for the specific home, coverage and date shown. Your address, construction, roof, coverage and discounts can produce a different result, even in the same ZIP code.
Does a home farther from the coast always cost less to insure?
Coastal exposure can affect pricing, but distance alone does not determine the premium. Roof and wind features, rebuilding cost, coverage and the available insurers matter too. I would compare the actual address before making a price assumption.
Should I wait until renewal to compare home insurance quotes?
You can ask us to review your options before your renewal arrives. If you are considering a change during the policy term, we’ll help you compare the timing and costs. Keep your existing coverage in place until any replacement is confirmed.
Do I need every roof or insurance document before I start?
No. Start with your address and the details you know. If you are unsure about the roof replacement year, you can tell us. My team can help resolve missing details as we review the quote.
How we put this together
Real quotes, with a clear scope.
We reviewed QuoteRush reports covering September 1 through October 31, 2026, with October 31 included through the time of collection. The homeowners files contained 837 positive carrier price returns across 72 quote files, representing 71 distinct property addresses. Multiple carrier prices and repeated quote runs are not counted as additional homes. Year built comes from the matching QuoteRush property record.
For each matched property, we used its latest quote date with the coverage fields shown here. We grouped prices by dwelling limit, AOP deductible and hurricane deductible, then selected the lowest positive premium returned in that scenario. If more than one scenario remained on the same date, we used the one with the most distinct responding carriers. We chose one home per ZIP and a second distinct home when the dwelling limits were at least $100,000 apart, using the lowest and highest available limits. That produced 64 examples across 61 ZIP codes and 28 counties.
We included higher as well as lower prices. This is a snapshot of homes our agency shopped, not a random sample of all Florida homes, a statewide average, a bound-policy record or a matched-home study of rate changes. Carrier packages can differ beyond the fields shown.
Customer names, street addresses, contact details and carrier identities are omitted. All prices shown are annual premiums. We have not divided them into monthly payments, which can have different billing terms. A personal quote is the way to confirm final coverage, any applicable fees and current availability for your home.
Market context comes from the September 22 OIR announcement and October 29 Florida regulator announcement. Sources checked October 31, 2026.
Let’s see what is available for your home
You don’t have to figure out the market on your own.
Tell us about your home once. We’ll use our technology and carrier relationships to compare the options, then help you understand the price and coverage together.
Compare My Home QuotesOr call 1-800-252-6885